Digging Deeper: What Segal’s Data Really Says About State Pay Gaps
Analysis of the recent salary report indicating gaps in public sector compared to market benchmarks.
Bottom line: Nearly half** of Alaska’s state employees would need a median 20 % raise to reach the Legislature’s own 65th-percentile pay target – and a quarter would need a median 25 % or more. “Within 5 % or 10 % of market” sounds small, but on a normal pay curve those cuts shove jobs 30–50 percentile points down the ladder.
1. How Many Ranges Behind?
Segal’s final dataset lets us segment employees by how many pay-range jumps they’d need to land on the 65th-percentile step for their job (two ranges ≈ four years of experience, or about 9–11 % pay in most schedules).
| Grouping | Share of studied workforce | Employees | Median % raise needed | Median $ raise |
|---|---|---|---|---|
| Needs ≥ 2 ranges | 48.8 % | 2,579 | +19.8 % | $13,980 |
| Needs ≥ 3 ranges | 28.4 % | 1,500 | +24.6 % | $18,027 |
| Needs ≥ 4 ranges | 9.6 % | 505 | +32.3 % | $21,414 |
Half of all benchmarked employees sit two full ranges or more below the target, requiring a median 20 % increase.
That’s a far steeper hill than the hearing sound-bites (“within 10 % of market”) suggested.
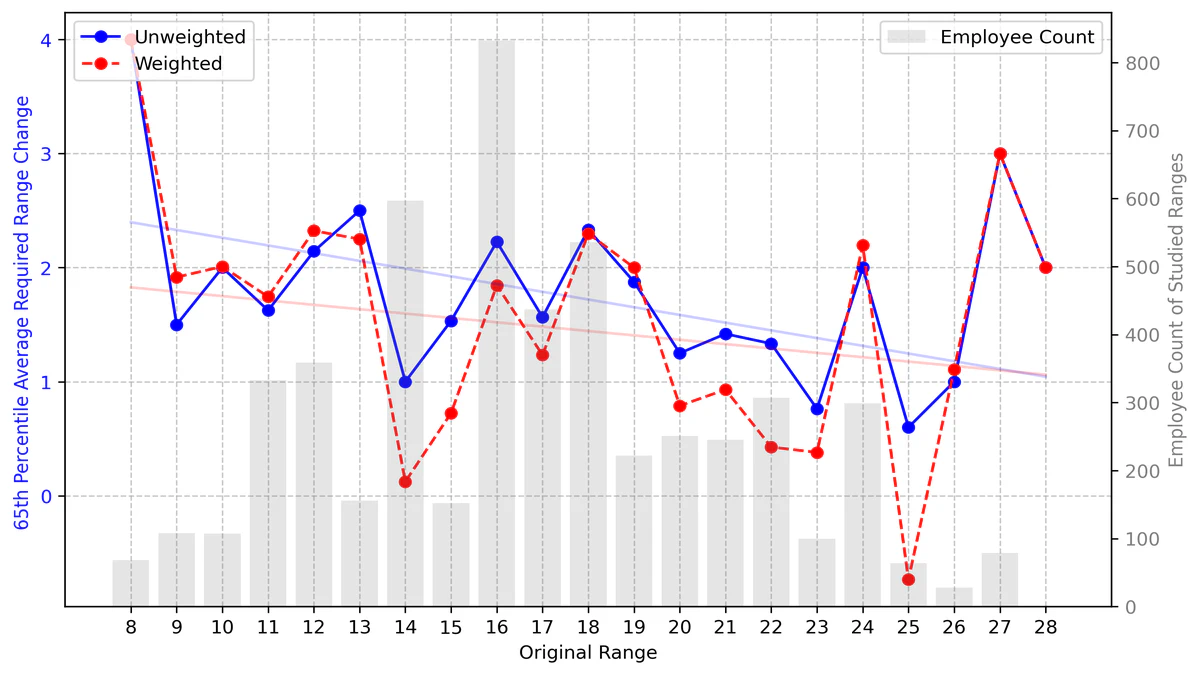
2. “High Ranges Overpaid, Low Ranges Underpaid”? Nope.
Some legislators hinted that they though top-range jobs are cushy while entry jobs lag. We plotted original range (x-axis) against range change needed (y-axis), weighting every dot by headcount.

- Pearson r = −0.14 (p = 0.008) – statistically significant but trivially weak.
- The downward tilt is classic regression to the mean: low ranges can’t drop much farther; high ranges can’t climb forever.
Take-away: Pay gaps do not systematically favor white-collar or high-range classes. Underpayment is widespread and mostly independent of the range level.
3. Why Percent-of-Target Rules Hide the Real Shortfall
During testimony, officials latched onto phrases like “within 90 % of midpoint” or “within 95 % of the 65th percentile.”
So we asked: What percentile in Segal’s assumed normal curve do those “almost there” numbers really buy?
| Statistic | What it measures | Median percentile it lands you in |
|---|---|---|
p50_90pct_percentile | 90% × market midpoint | 12th percentile |
p50_95pct_percentile | 95% × market midpoint | 28th percentile |
p65_95pct_percentile | 95% × 65th-pct target | 42nd percentile |
How to read this
Shaving just 5 % off the Legislature’s own 65th-percentile target drops a typical job to the 42nd percentile – already below average. A “small” 10 % discount from the 50th percentile, the target the administration wants us to believe is fine, dumps half the jobs to ≤ 12th percentile… the bottom one-eighth of the market.
Lesson: When you hear “within X % of market”, always ask “what percentile does that equal?”
Percentages shrink; percentile rank collapses.
4. Key Insights for Lawmakers & the Public
- Magnitude matters. Two-range and up gaps mean 20 % raises, not 2 %.
- No easy swaps. Tightening high ranges won’t fund the low ones – both sides have gaps.
- Percentiles, not percentages. 65th percentile is the benchmark Alaskans wrote into law; hold the conversation there.
- Targeted triage, then full fix. Sure, start with the 48 % needing two-plus ranges – but plan publicly for the rest.
- Transparency builds trust. Publish the full percentile tables with every pay proposal so stakeholders see the real positioning.
5. Where We Go from Here
- Stop Kicking the Can: Fund the first round of range adjustments – especially the classes > 20 % behind.
- Follow the data: Round to the nearest range, stop with the percentile to percentage bullsh*t.
- Keep it moving: Update market surveys every three years so we adjust incrementally, not after another 15-year cliff.
- Tell the story: Every range correction restores a public service – from safer highways to faster benefits processing. Let’s track and share those wins.
Why This Matters
Alaskans value fairness, responsibility, and respect. Underpaying nearly half our workforce by a median one-fifth of their salary isn’t fair, it isn’t fiscally responsible (vacancies cost more), and it disrespects the people who keep our state running.
The data are clear. Now let’s match our paychecks to our principles.
Full code, notebooks, and visualizations live at GitHub › AK_Salary_Study for anyone who wants to check the math or build on the work.
Key Takeaways from the Legislative Hearings
Last week both the Senate and House Finance Committees heard Segal Group executives present the study. Here are a few highlights:
- Critics charged that the administration stalled the study and shifted parameters mid-course to soften its impact on employee leverage Juneau Empire
- Segal estimated roughly $93 million to hit the 50th percentile vs. $180 million to hit the 65th—no final decision on which target will drive the Legislature’s next budget ask
- Of 36 “income buckets” (12 occupational groups × min/mid/max steps):
- At 50th, 21 buckets fall at 89–99 percent of market; at 65th, 31 fall at 85–98 percent
- Legislators probed how benefits (health, retirement) factor into “competitive” pay, and raised questions about whether public-sector roles should aim to be “market-leading”
- Efforts to restore a defined-benefit pension stalled again over cost concerns—likely extending the debate into next year
For the full write-up and excellent context on those hearings, check out the Juneau Empire’s article:
Shortcomings revealed in state employee salary study won’t be addressed until at least next year Juneau Empire